
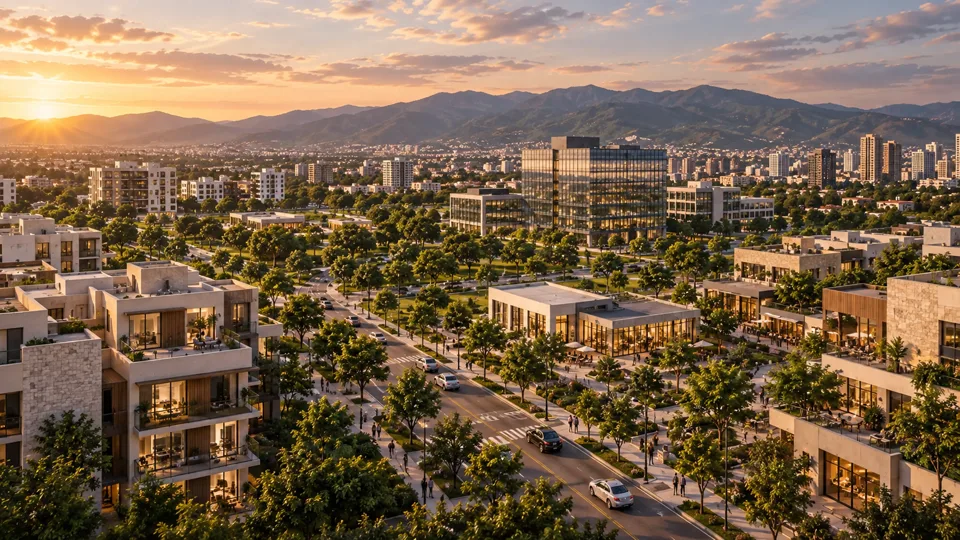
Mexico’s real estate markets: 14 cities and a framework for comparison
INMO1’s national guide to comparing 14 real estate markets by demand, product, infrastructure, absorption and risk, without misleading averages.
Read analysis →Air connectivity, second homes, population growth and water: the variables that shape real estate feasibility in Los Cabos.

Los Cabos combines international tourism, local residents, second homes, luxury product and a service economy that requires housing for workers. The most costly mistake is to treat these sources of demand as equivalent, or to assume that airport growth automatically translates into real estate sales.
The municipality reached 351,111 residents in 2020, 47.2% more than in 2010. That pace, together with the scale of tourism, creates a dual requirement: product for buyers from outside the area, and housing solutions, mobility and infrastructure for the population that keeps the destination running.
San José del Cabo Airport recorded 7.53 million passengers in 2025: 4.69 million international and 2.84 million domestic. New routes expand the potential catchment area, but a passenger is not necessarily a unique tourist, homeowner or buyer. A passenger may also be a resident, worker, connecting traveler or repeat visitor.
For tourism-oriented residential product, air passenger origins must be assessed alongside length of stay, spending, season, intended use, financing availability and repeat-purchase behavior. For local housing, wages, employment, commuting and services matter.
Between January and April 2026, DataTur reported hotel occupancy of 79.8% in Cabo San Lucas, 72.0% in the Corridor and 69.1% in San José del Cabo. Changes relative to 2025 differed. This variation confirms that even the hotel market should not be summarized as a municipal average.
Occupancy at participating hotels does not include all vacation rentals and cannot be used to calculate returns on a residence. A model needs net rates, commissions, maintenance, operations, replacement costs, vacancy and seasonality.
The municipal plan reported 121,645 total homes in 2020: 101,934 occupied private homes, 10,361 vacant homes and 9,303 occasional-use homes. It also stated that 76.9% of homes had piped water, and estimated additional requirements to maintain continuity of service in Cabo San Lucas and San José del Cabo.
A water deficit does not mean that every project is unviable; it means that the source, capacity, connection, treatment and operation must be verified before valuing land. Workforce housing also affects staff turnover, commuting and operating costs throughout the tourism ecosystem.
| Demand | Decisive variable | Insufficient metric |
|---|---|---|
| Second homes | Origin, use and liquidity | Passengers |
| Tourism rentals | Net income and season | Hotel occupancy |
| Local housing | Income, commuting and services | Total population |
| Luxury | Product, view, brand and exit | Municipal average |
In Los Cabos, feasibility extends beyond selling the view: it integrates connectivity, use, operations, infrastructure and housing for the city that supports the destination.
For a specific asset, INMO1 defines the submarket, surveys competitors, standardizes product and price comparisons, verifies inventory and estimates absorption using a consistent definition. It then connects these findings to product, phasing, capital and sensitivity. This work helps distinguish a favorable trend from a defensible opportunity in Los Cabos.
Compare this market with the guide to Mexico’s real estate markets. Learn more about the scope of a real estate market study, real estate feasibility and supply, demand and absorption analysis.
Are you assessing land, a development or inventory in Los Cabos? Request a diagnostic consultation with INMO1.
Editorial cutoff date: September 18, 2026. Figures retain the geography, unit and period of their source. Demographic, tourism or economic context does not by itself establish demand, sales, absorption or real estate returns.
INMO1’s national guide to comparing 14 real estate markets by demand, product, infrastructure, absorption and risk, without misleading averages.
Read analysis →
A guide to combining INEGI, SHF, Banxico, SNIIV and Data México without confusing population, prices, credit, advertised supply and effective demand.
Read analysis →
Absorption, inventory, product mix and achieved prices are the four indicators that determine a project. We explain each one, how it is measured and why the data source changes the result.
Read analysis →